
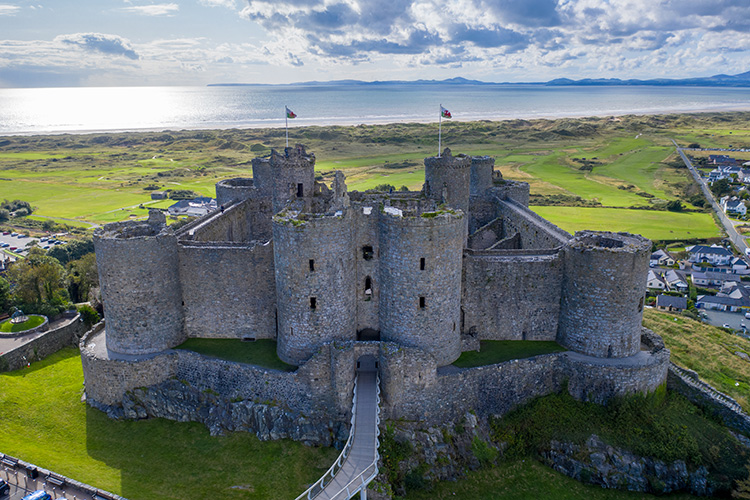
This summer I spent some time on the coast with the family. One of the places we stayed was Harlech in Wales, which is most famous for its castle. It dominates the landscape, looking down from the hilltop across the beaches and the golf course. On closer inspection though, the castle seems out of place. There is an outer wall and path that runs down the back of the castle to the ‘Water Gate’, where there was once a dock. The castle survived a seige in 1294 by bringing in supplies by boat. It’s hard to imagine now, because that dock is nowhere near the sea.
In the 739 years since the castle foundations were laid, the coastline has been rearranged. This isn’t climate change – it’s storms that have shifted the dunes and left the fortress inland, a kilometre from the water. But it’s a striking reminder that coastlines are fluid things. And the biggest force that will re-arrange them in future is climate change.
We know that as the world warms, the combination of ice melt and thermal expansion will raise sea levels. That will redraw the map of my island nation. The sea will encroach into low-lying areas. New wetlands will emerge, old wetlands re-establish themselves. Estuaries and river valleys will widen. Some areas will flood repeatedly. In some cases this will prompt new flood defences, in others retreat and abandonment.
For a preview of possible changes, there is an interactive map at Climate Central. This is not a prediction, and it’s worth saying that up-front. It’s a mapping of projected global sea level rise against terrain, and it’s looking ahead several decades. It can’t predict measures taken to avoid emissions, or local steps to prevent flooding. So it’s very much a map of risk – of what could happen.
With that in mind, here are some highlights.
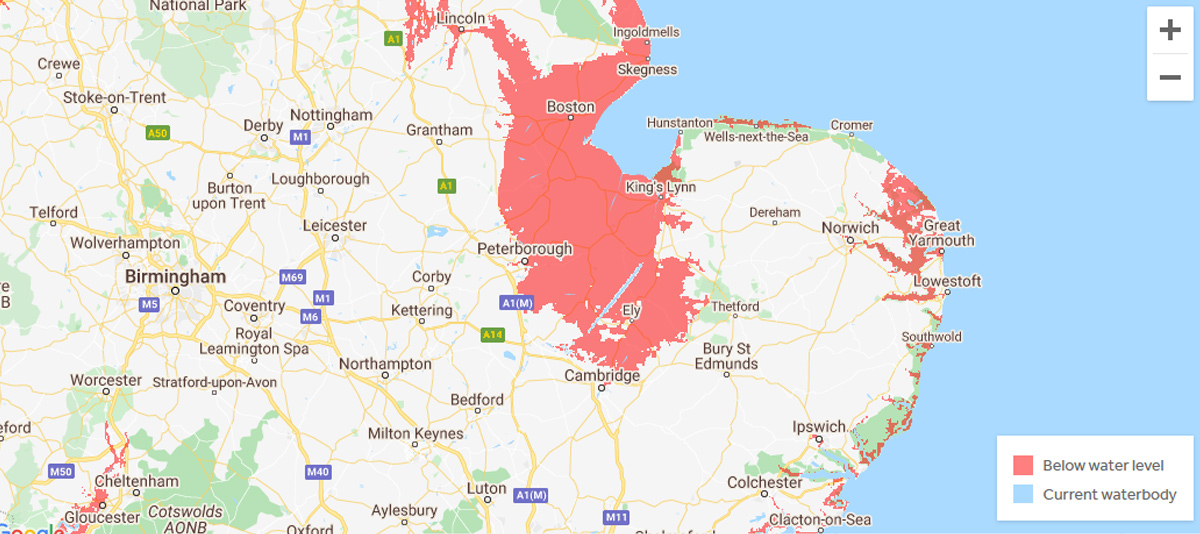
Looking at the country as a whole, the east of England looks most vulnerable. It is low lying and flat, and has that big bite taken out of the coast between Norfolk and Lincolnshire. That’s the estuary known as The Wash, and by 2100 it could be several times larger. Ancient towns such as Ely and Boston would be lost to the water. Peterborough and Cambridge would no longer be inland cities, which is a pretty drastic recalibration of their identity. Out to the east, the Norfolk Broads would flood, leaving a series of new islands.
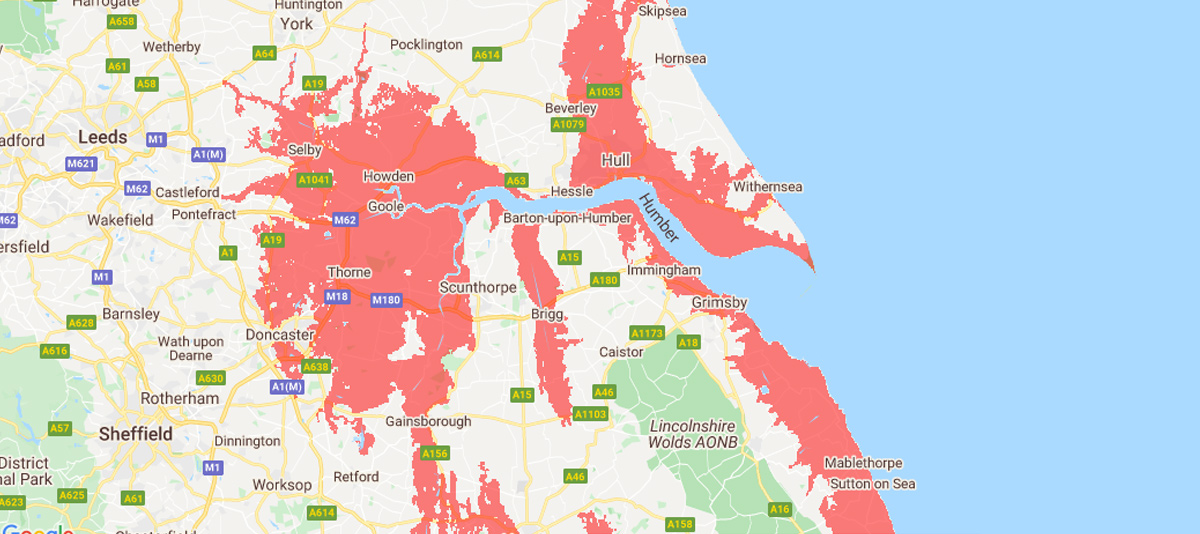
Another area at risk is the Humber, where the city of Hull looks under threat. Much of the flooded area is farmland, representing a loss to Britain’s food production.
Where there are large rivers, encroaching sea levels can reach a long way inland. That includes London. The Thames river is tidal, and London faces severe flood risk in the years to come. The areas most at risk are to the East, which also happen to be the more disadvantaged areas of the city. This could create a whole series of environmental justice questions in the future, as richer areas lobby for flood defences or buy-outs, while poorer areas are overlooked.
With London built around the river, the risk extends right into the heart of the capital, and would force existential decisions on some treasured institutions. How long can Parliament continue to meet on the riverside? How much of the tube network will be functional? With heritage properties and historic sites all over the city, which ones can be saved? Where will the city draw the line, and how much is it prepared to spend to defend itself?
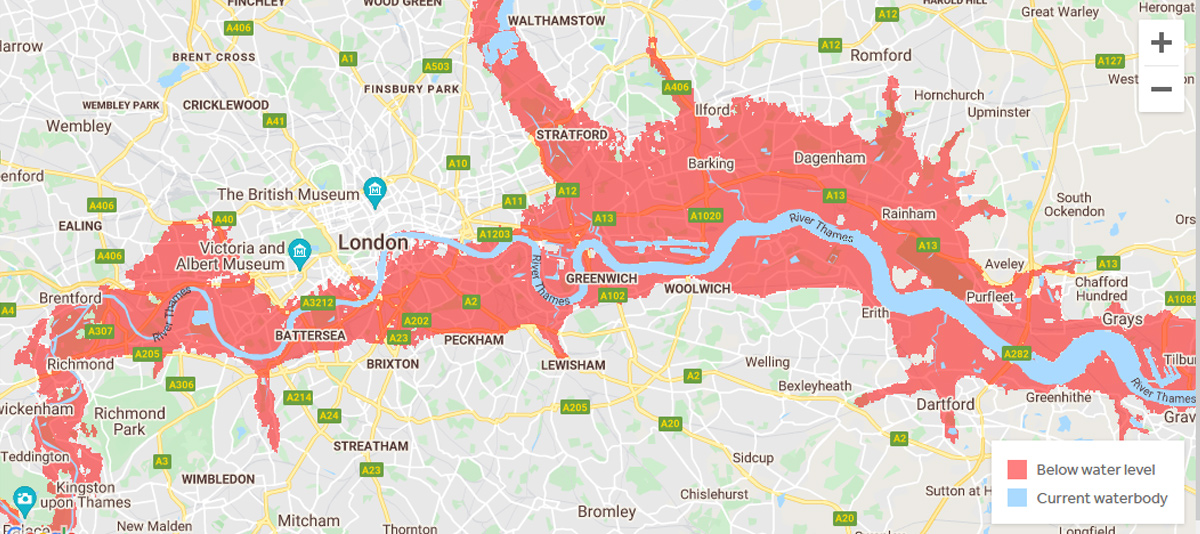
As I say, these are risk scenarios, not predictions. The red areas in the map are those that will be below sea level in 2100, but that doesn’t mean they will be underwater. Much of that low lying land would flood regularly already if London didn’t have the Thames Barrier keeping high tides and storm surges at bay. Just yesterday I was walking along the side of the Thames on the way home from an Extinction Rebellion action at the Bank of England. I had to lift the kids up to see over the flood wall and look at the boats, but adults have a good view. If the Thames barrier wasn’t there, those walls would need to be double my height and that would be the end of the riverside walk.
The question for London is whether the Thames Barrier, which was first proposed in the 1960s, is climate proof. Is it enough? And that’s the reason to look at these maps now. Where are the risks? What is the best adaptation strategy for the affected regions? This is a discussion for each local authority to consider, as it has very real implications for their residents.
To return to where we began, Harlech today is built half on the hillside by the castle, and half on the flat ground at the foot of the hill. We stayed in an apartment in the lower part of town, just off to the right in the photo above. That apartment will not exist in 2100. A whole community will have to relocate. The village will lose its main road and its railway connection, the beaches and the community centre. Harlech will have to re-imagine itself again. The sea will return to the foot of the castle, and the waves will lap once again at the Water Gate.

So there will be internal migration and refugees. House prices in higher areas will rise a great deal, in low places they ought to collapse. And what about our coastal nuclear power stations and other key infratructure?
Indeed, though hopefully by considering maps like these ahead of time, it will be a case of managed retreat rather than emergency displacement. A lot of people are going to find themselves with houses they can’t sell, and that’s going to be a crisis of its own. The residents of Fairbourne may be the first to experience these sorts of debates: https://www.walesonline.co.uk/news/wales-news/welsh-village-being-abandoned-sea-16330847
Infrastructure is going to be an important question. In Harlech, for example, I suspect they will build a sea wall to protect the railway. The homes on the wrong side of it will be lost, but it the railway will be too important to lose – both for the town and those further down the line.
In 80 years it seems that parts of the UK are subject to the sea level rise. Scary!