Britain experienced its hottest ever summer this year, pending end-of-year verification. While you can never really point at something and say definitively that it is climate change, the Met Office tells us that climate change made this summer 130 times more likely, which is as good as you’re going to get. Climate change is transforming the British summer.
We’re still getting used to that idea, with different interpretations of what that should mean. For the privileged, it means drinking English sparkling wine and congratulating yourself on not being poor. For people with serious health conditions, or working outdoors, or living on the top floors of tower blocks, it’s an altogether more challenging time and can even be deadly. Government statistics show 2,877 heat-associated deaths from the May and June heatwaves.
One place that is taking summer heat seriously is the coastal city of Brighton & Hove, which has just released a street-by-street analysis of heat across a 1km square of downtown. The urban heat island is a well known phenomenon, but if you want to do anything about it you need more detail on where it gets hottest and what the solutions might be. You can’t cool a whole city at once, but if you can identify specific locations that overheat and overlay that with data on where people gather, you can make a difference to citizen’s experience of heat.
The study was carried out by Hannah Dunsby and combined meteorological records for 2022 with LIDAR data that maps streets in fine detail and three dimensions, accounting for building heights, street furniture, trees and plants. They found that during heatwaves, it gets hottest in wide streets, in open spaces, and at transport hubs. This gives us some priorities.
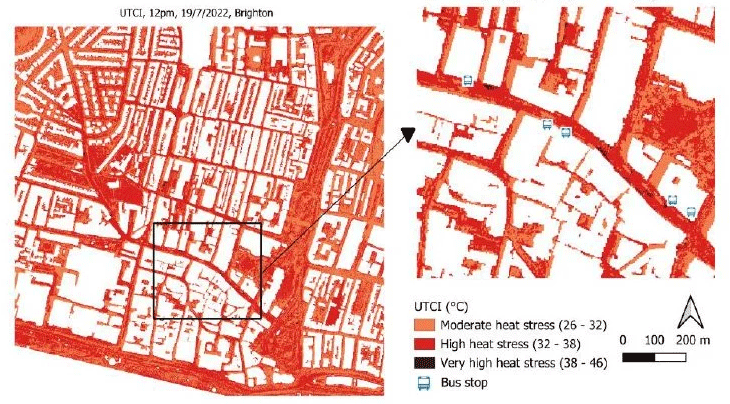
For example, North Street is a busy road with little shade and prone to overheating. It has a series of bus-stops where people have to stand and wait in the heat. Those bus stops are good locations for cooling interventions.
A briefing paper on the research makes a series of recommendations, prioritising cooler spaces, creating shade, and cooling buses. Data mapping can spot homes at risk, and in music to my ears – schools at risk of overheating. I’ve done a lot of work on school overheating this year, including mapping exercises and surveying to identify problem areas of the country. More on that another time, but this kind of detail in specific places is exactly the kind of thing we need to build resilience.
There’s work to be done at the institutional level too, building “the summer equivalent of the winter machinery”. That refers to collaborative approaches that bring together social services, emergency responders, housing and community organisations. This already happens in winter to keep people safe, and we need the same for the summer. Not just for the 40C days that make the news, but the ordinary hot days in a warming city.

