It’s no great secret that climate change is predominantly caused by the world’s richest. Carbon footprint tends to expand along with wealth, as people fly and drive, eat more meat and run more appliances. It’s no surprise that other environmental limits see a similar pattern.
A study in Nature offers this useful visual summary of the planetary boundaries, divided into deciles. In the case of climate change, the red segment below, we see that the richest 10% are responsible for 43% of carbon emissions.
The pattern repeats with the richest responsible of 23% of damage from land use change, 24% of nitrogen and phosphorus pollution. For biodiversity loss the share is 37%, and water use at 18%. All of these, you will notice, breach the safe limit, which is marked by the red line near the centre of the graph. It’s even worse if you split the top 1%.
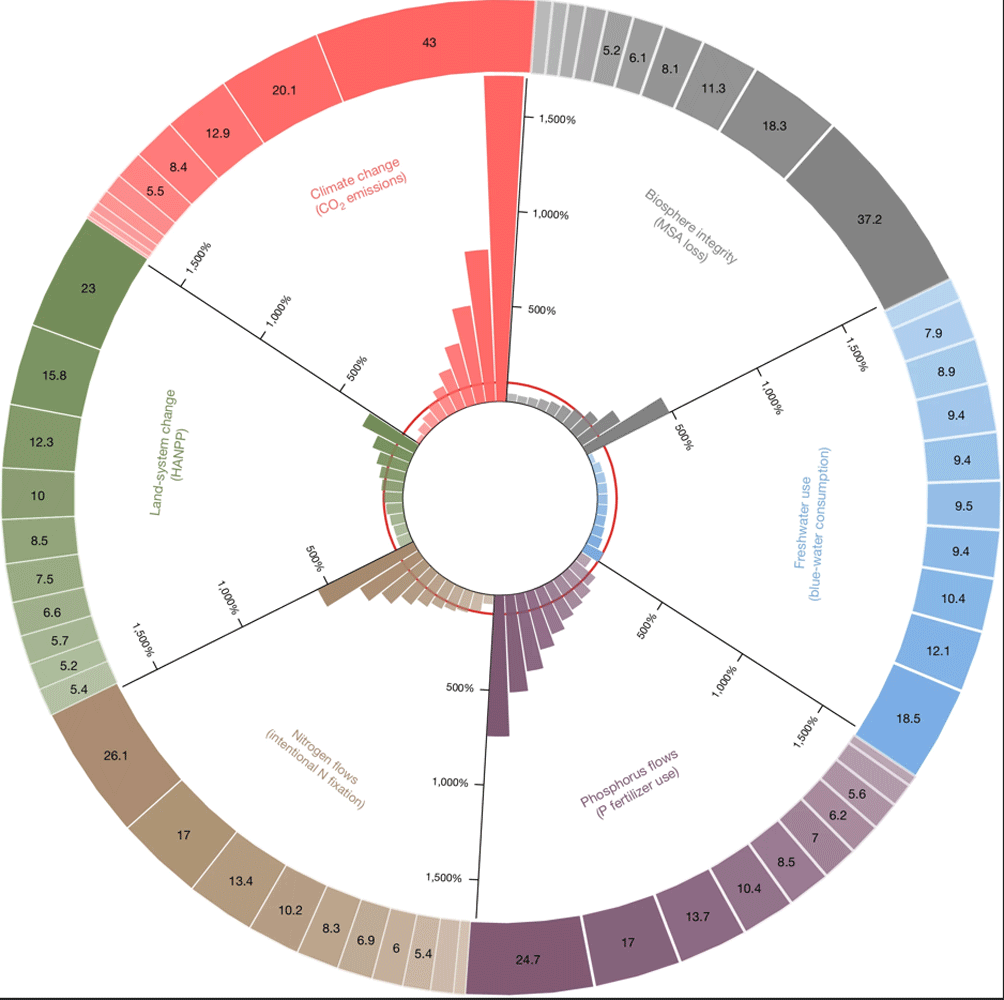
At the other end of the economic ladder, the poorest decile are responsible for relatively and are within the safe thresholds on all six measures here.
“Our analysis reveals extreme inequality in environmental footprints,” write the researchers, “highlighting the disproportionate responsibility of affluent groups in both developed and developing countries.” A reminder then, that while environmental action needs everyone, the need to reduce consumption applies first and foremost to the richest.
 The Earthbound Report