
 In 2009 Johan Rockstrom and colleagues at the Stockholm Resilience Center published the Planetary Boundaries report. It identified nine environmental boundaries, and within them, a ‘safe space for humanity’.
Kate Raworth, at Oxfam at the time, then added another element. Looking at the famous circular chart of the boundaries, she realised that no environmental impact meant destitution: “It’s not just a green circle. There’s a place in the middle where you don’t want to be.” Along with the outer environmental limits that we need to stay below, there is a social floor that we need to stay above in order to guarantee a good standard of living. That gives us a doughnut.
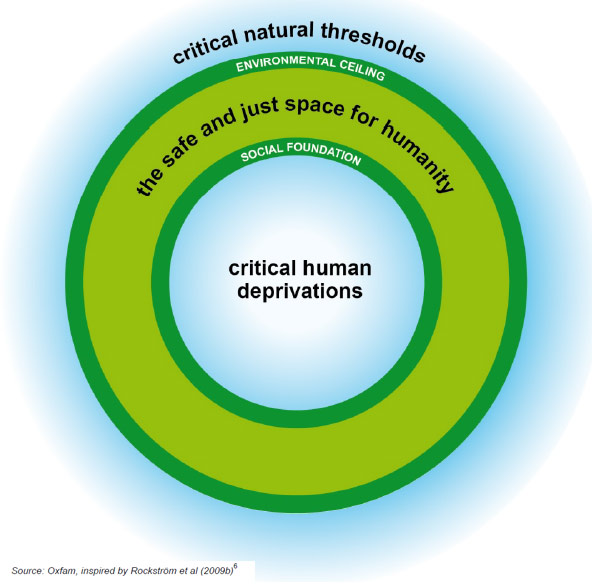 This insight has travelled a long way, turning up in UN documents and sustainability discussions around the world. It’s a useful concept because it reframes sustainability into something that we can aim for – prosperity within boundaries. It offers a compass or top level goal that brings together the environmental and the social.
Several projects have taken on the challenge of bringing the doughnut concept down to the national level, looking at individual countries’ contribution to the planetary boundaries, and how they were performing on a range of social targets. It’s been done in Sweden, South Africa and a number of other countries, and today I got along to the launch of Oxfam’s ‘UK doughnut’.
As co-author Katherine Trebeck explained, the UK doughnut is a ‘snapshot’ of Britain’s situation across a range of metrics. Round the outside we have the environmental boundaries, including air quality, climate change, the nitrogen cycle and biodiversity loss. Britain is in overshoot on nine out of the ten – some only just, others quite dramatically. 11% of our rivers are classified ‘poor’ or ‘bad’ on phosphorus pollution, which seems manageable. But 64% of our fish stocks are harvested unsustainably. On climate change, we have exceeded the boundary by 410%.
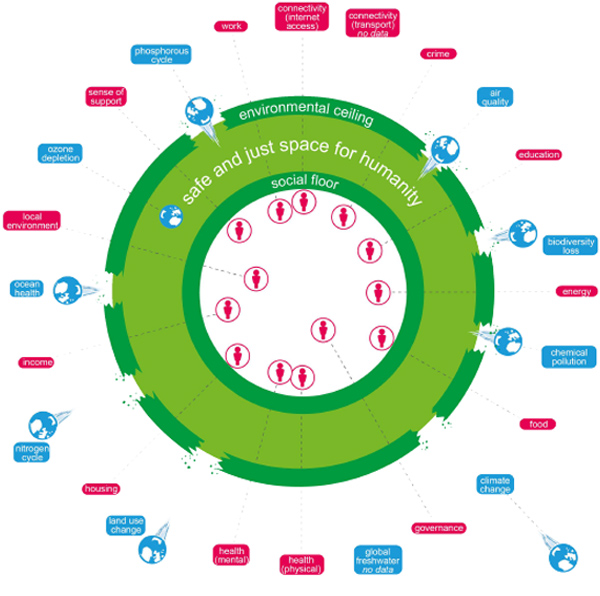
The ‘social floor’ doesn’t look too rosy either. 25% of adults don’t have any formal qualifications. 1 in 5 report a high level of anxiety. 26% of households live with fuel poverty. Other metrics come out better. Just 7% of people lack access to the internet as a result of barriers (eg lack of skills or money rather than by choice). 3% of households are overcrowded.
There are a variety of metrics that could be used for many of these, overcrowding being a case in point. In looking at our housing situation, you could look at homelessness. You could also look at affordability, or at quality of housing. There is often inadequate data, or no appropriate index, and the report highlights several areas where information gathering could be improved.
The authors are honest about the complications involved, and the limits of the science. Future iterations of the concept will no doubt refine it. But for now, the UK doughnut is a bold attempt to visually summarise a framework for environmental sustainability and social justice.
To find out more, download The UK Doughnut report or read Katherine Trebeck’s introduction here.
